Chapter 38 Bins Scoring
In our program, most undergraduate lab reports are graded by GTAs, not faculty. A priority when we train GTAs is ensuring they know how to grade students fairly, and have good inter-grader reliability (different GTAs give similar scores for work of similar quality.) We also want GTAs to know how to give actionable feedback that helps their students grow as writers. Finally, we want GTAs to spend their grading time efficiently.
To accomplish those goals, our GTA training program includes a general writing orientation and practice sessions, and round-robin grading where new and experienced GTAs grade the same pre-selected set of reports, then discuss discrepancies in scoring. This is explained elsewhere.. To further improve consistency we:
- Use bins scoring. This grading strategy is based on Linda Nilson’s Specifications Grading. Briefly, we limit the number of items used for scoring reports, and only score those items on a binary scale (present/absent, yes/no, etc.) This part of our process is explained below.
- Limit the number of comments GTAs give to what their students can manage.
- Give students feedback in the form of reflective coaching. This is explained elsewhere.
- Have GTAs refer students back to specific sections of this Resource Guide instead of writing out their own recommendations.
38.1 Bins Criteria
These are the criteria we use to assign scores to lab reports in our 100-level lab courses. Our criteria are divided into basic criteria, technical flaws, and writing quality flaws.
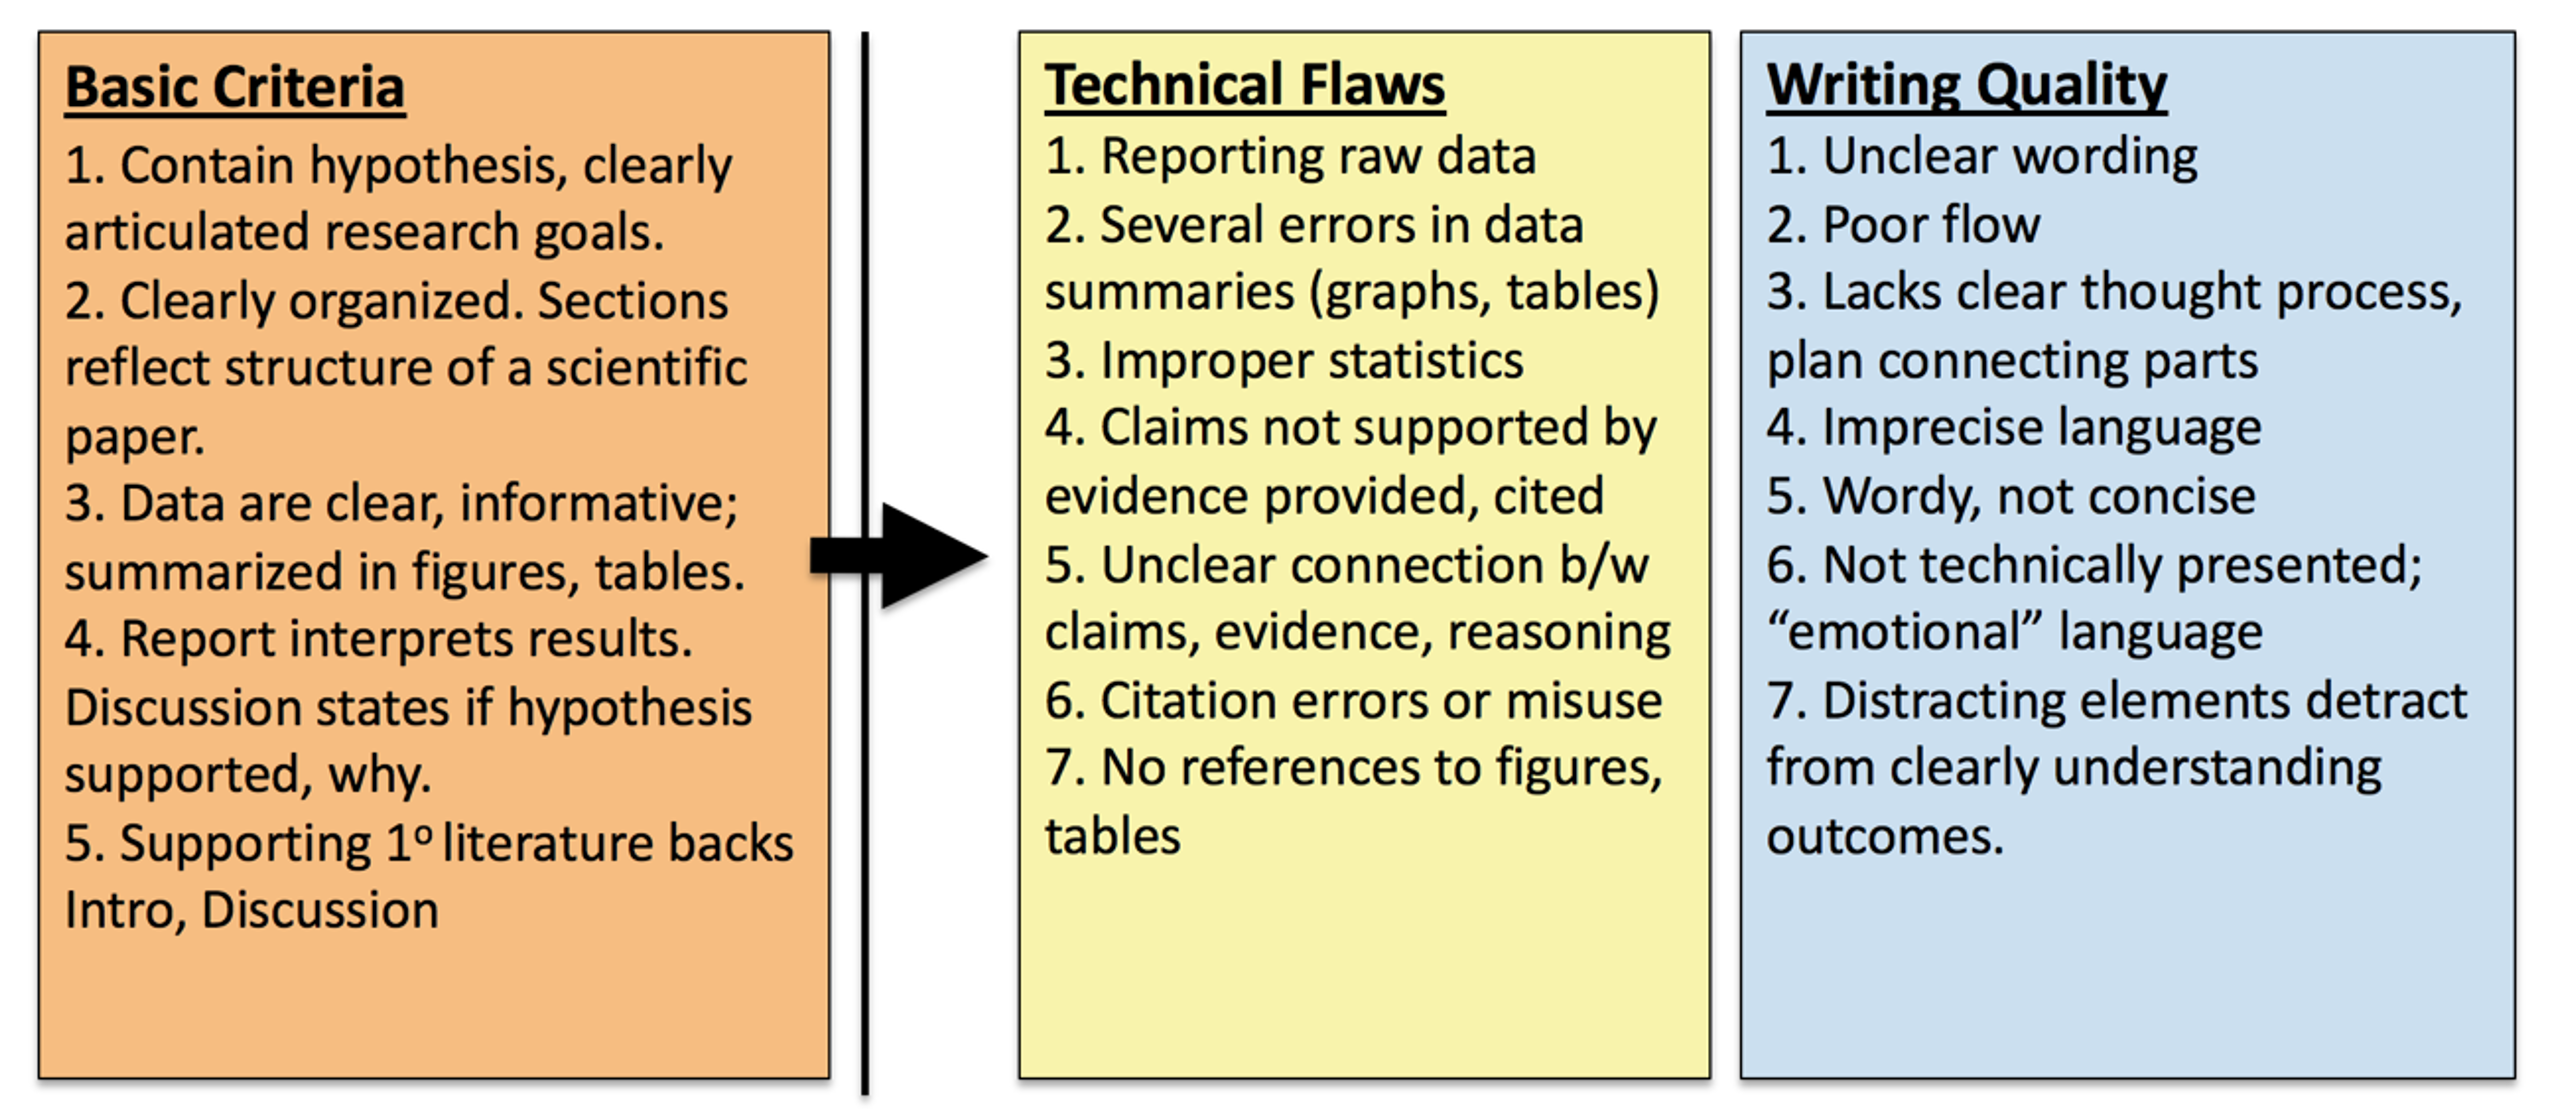
We set our five Basic Criteria based on the fundamental structural errors that we have historically seen most often. These are strict minimum requirements; if a student’s report does not meet them it is marked “Unacceptable,” and returned with minimal feedback. While this seems overly harsh, in practice it is not. Prior to implementation, up to 36% of all reports submitted were incomplete. One year after implementation, this one requirement reduced the number of incomplete reports submitted for grading to 1-3% of all reports. GTAs spent less time trying to comment on incomplete reports, and could focus on more meaningful revisions. End-of-semester averages for student report scores rose 4-6%.
Items listed under Technical Flaws or Writing Quality Flaws also are our most commonly encountered errors; other flaws are outlined in this Resource Guide. Again, the presence of technical and writing quality flaws is marked on a binary “yes/no” scale. Reports are scored as having both technical and writing flaws, having either technical or writing flaws, or having no or minimal technical or writing flaws.
We do not assign numeric grades based on points, but instead describe the overall quality of a students work relative to our goals. These are the terms we use, and how they translate to course grades.
| Descriptor Term | Criteria | Translated Grade in Course |
|---|---|---|
| Acceptable | Meets all basic criteria, minor writing and technical flaws only | “A”/95% |
| Needs minor revisions | Meets all basic criteria, has EITHER writing OR technical flaws | “B”/85% |
| Needs major revisions | Meets all basic criteria, has BOTH writing AND technical flaws | “C”/75% |
| Submitted but Unacceptable | Fails to meet 1+ basic criteria | High “F”/55% |
| No report | Report not submitted, or plagiarized | “F”/0% |
38.2 Workflow
In our program, GTAs have 7 calendar days to grade and return 30-35 student reports. To make their grading time efficient, we recommend GTAs organize their grading process the first few times as described below. As they gain experience, many find other ways that work better for them individually. Other workflows are fine so long as they maintain consistency with other GTAs.
Keep Time
- Allocate 10-15 minutes per report. Use a lab timer or stop watch app on a cell phone to keep track. If you fall behind, decide whether you are tired and should take a break, or are spending too long on each report.
- Budget time appropriately. Occasionally a report needs so much work that a face to face meeting with the student to discuss the problems will take less time than writing out comments. If this is the case, stop and schedule a meeting.
First Pass: Initial Sorting
Open each report in MS Word and SKIM it (1 minute or less), looking for the features in the table below. When you see one, highlight it and attach a comment box (you will refer back to these in the next step.) Sort reports into 3 provisional groups.
- Clearly unacceptable. One or more basic criteria are obviously missing.
- See some technical or writing flaws.
- No obvious flaws.
| Feature | Interpretation/Group |
|---|---|
| Are all required sections there? | “No” on ANY item means report goes into “Unacceptable” group |
| Do you see citations in Introduction AND Discussion? Look for [Name, Year] format | |
| Quickly read last 1-3 lines of Introduction. Is there a hypothesis near end of Introduction? | |
| Is there a table or figure summarizing data? | |
| Quickly skim first 1-3 lines of Discussion. Does author reference their hypothesis? | “No” should go into “Some flaws” group initially, but it could be elsewhere |
| Does the flow and wording sound reasonable for a technical audience? | “No” should go into “Some Flaws” group |
| Do figures or data tables at end look right? | Do citations at the end look generally right? |
| Nothing stands out in first brief skim through | Put in “No obvious flaws” group |
38.2.1 Second Pass: Double-Check & Read Deeper
This time don’t grade one entire group at once. Take a report from each provisional group in turn.
- This helps you avoid getting frustrated when grading.
- You are more likely to subconsciously change your grading standards if you keep grading reports of similar quality.
- Remember that your first pass was an initial sort only. If you re-read a report an see that you sorted it incorrectly, move it into a different group.
This time you read the full text of each report. You have three goals this time.
- You already marked several items with comment boxes. This time you should confirm that they are actually present/ flawed/ absent.
- Identify the 2-3 highest impact corrections that the student needs to make. These are what you will point out in your reflective coaching comments. Put your coaching comments on the first page of the report, with the student’s overall score. Remember, these comments should directly reference the criteria.
- Identify and provide short comment on other errors. Limit these to 3-5 per page. Avoid simple copy-editing. As often as possible, address these errors by:
- Asking reflective coaching questions, or
- Referring students to the Resource Guide or other reference sources.
38.2.1.1 Strategies For Marking Up Each Group
- Unacceptable Group:
- If one of the 5 basic criteria) is indeed missing, leave the report in this group.
- Identify all of the essential items that the student does not have.
- In the front page comment, list which required items are missing, and the score, then stop.
- You are not required to provide any further comments. A report that does not meet basic criteria should take LESS time to grade, not more.
- Some Flaws Group:
- As you read, separate reports into 3 sub-groups:
- Flaws in writing only
- Flaws in technical execution of stats, figures, tables, etc.
- Flaws in BOTH areas.
- As you divide the reports, look for the larger/global errors the student should address first. What 2-3 corrections that the student could make that would make the report fundamentally better?
- In the front page comment, summarize the most important corrections needed, and the score.
- Add no more than 3-5 short comments per page. Use these comments to point out smaller corrections, not the global issues. Comments should be questions or refer to other sources if at all possible.
- As you read, separate reports into 3 sub-groups:
- No Obvious Flaws Group:
- Double check that you did not overlook any writing or technical flaws.
- Identify 2-3 points where you think the report could be improved.
- In the front page comment, summarize the most important areas the student could improve, and the score.
- Add no more than 3-5 short comments per page. Use these comments to point out smaller corrections, not the global issues. Comments should be questions or refer to other sources if at all possible.
- As the grader, remember that even if a report earns the highest possible score, it can always be better.
38.2.2 Provide Feedback By Reflective Coaching, Not Copy Editing
Reflective coaching comments have both specific information or guidance/rationale, and foster thinking. Often they have open ended questions that help a student think about BOTH WHAT TO CHANGE AND WHY. This approach is harder for students at first, but with practice students learn to self-correct the indicated error, and apply similar thinking to other situations. This is covered as a separate topic.
Tips:
- If you find you are putting the same comment on different reports, create a master list of comments and copy/paste the appropriate ones rather than re-typing them.
- If you are an experienced TA, remember that the Resource Guide is updated regularly. Double-check that you are using the correct page numbers for the current version.
- We expect reports to be graded and returned to students within 7 calendar days, meaning by the next lab meeting.
38.2.3 Record Report Scores in the LMS Gradebook
Be sure your students understand that we do not assign numeric grades based on points, but instead describe the overall quality of their work relative to our goals. These are the terms we use, and how they translate to course grades.
- Acceptable. Translates to an “A”/95%.
- Needs minor revisions. Translates to a “B”/85%.
- Needs major revisions. Translates to a “C”/75%.
- Submitted but Unacceptable. Translates to a high “F”/55%.
- No report submitted, or plagiarized. Translates to a zero.
38.3 Instructors’ Supplement
38.3.1 Adapting Your Guide
The basic criteria we use reflect the five fundamental errors that we saw our students make the most often. We recommend adjusting these criteria by sampling previously graded local reports.
Select ~50 reports that earned a score of <70% (D range), and another 50 that earned a score of 70-80% (C range). Do not use reports that earned an A or B yet; the goal is to establish the benchmark criteria distinguishing C level and D level work.
Compare 2 reports, one from the D range, one from C range. What is missing from the D range report that is present in the C range report? Look for traits that can be scored as binaries (yes/no, present/absent.)
Record the key differences for this first pair.
Repeat the process for 40 pairs. Hold back the last 20 reports (10 each with grade C or D) for testing the final criteria.
After completing the 40 initial comparisons, group similar features into 5-7 discrete binary criteria that can differentiate reports earning a C from a D.
To evaluate the inter-rater reliability of the selected C vs. D grading criteria, have two independent readers use them to score the remaining 20 reports. The independent readers should assign the same score of C or D on 80% (16/20) reports or more.
If the two readers assign scores that are different from each other for more than 20% of reports, review the criteria with them to determine whether the explanation of one or more criteria needs to be refined, or if the criteria are not sufficient to discriminate between a C and D level report.
The local criteria for technical, writing, and logical flaws are identified the same way, by comparing past reports that earned an A vs. B vs. C.