Chapter 45 Appendix B: Physiology Topic
Background For This Sample Topic
What Are the Costs Versus Benefits of Nerves & Muscles?
Nerves and muscles are highly specialized tissues that are unique to animals. Both vertebrate and invertebrate animals use nerves to sense their internal and external environments then use muscles to respond within milliseconds. Fungi and plants do not have a comparable system of rapid intercellular communication and response. Instead they rely on hormones and related chemical signals that are transported between cells and in body fluids. As a result, plants and fungi usually sense and respond over seconds to days.
A.
B.
Figure 1. A. A Venus fly trap uses changes in hydrostatic pressure to close its hinged leaves. This is one of the fastest movements found in plants. However the trap simply is closing when hairs inside the trap are bent or touched, regardless of whether it is triggered by an insect or by a piece of debris. It cannot discriminate between prey and non-prey. B. The second video shows a marine cuttlefish distracting then snatching prey. Cuttlefish use their neuromuscular system to grab prey much more quickly. Unlike a Venus fly trap, the cuttlefish ADDS sensory information that lets it distinguish between prey and non-prey.
Organization of the Somatic Neuromuscular System
Skeletal muscle in both vertebrates and invertebrates consists of hundreds to thousands of myofibers. Each myofiber is a long cylindrical, multi-nucleated aggregate formed from thousands of individual muscle cells that have fused together. Millions of individual myofibers are bound together by connective tissue to form functional groups, which are the skeletal muscles proper.
Skeletal muscles are innervated by motor nerves. Each nerve is made up of thousands of motor neurons, whose cell bodies are located in the gray matter of the spinal cord. The axons of the motor neurons (wrapped in myelin) extend into a muscle then branch out to innervate several individual myofibers. Each point of connection between a motor neuron and skeletal muscle is called a neuromuscular junction.
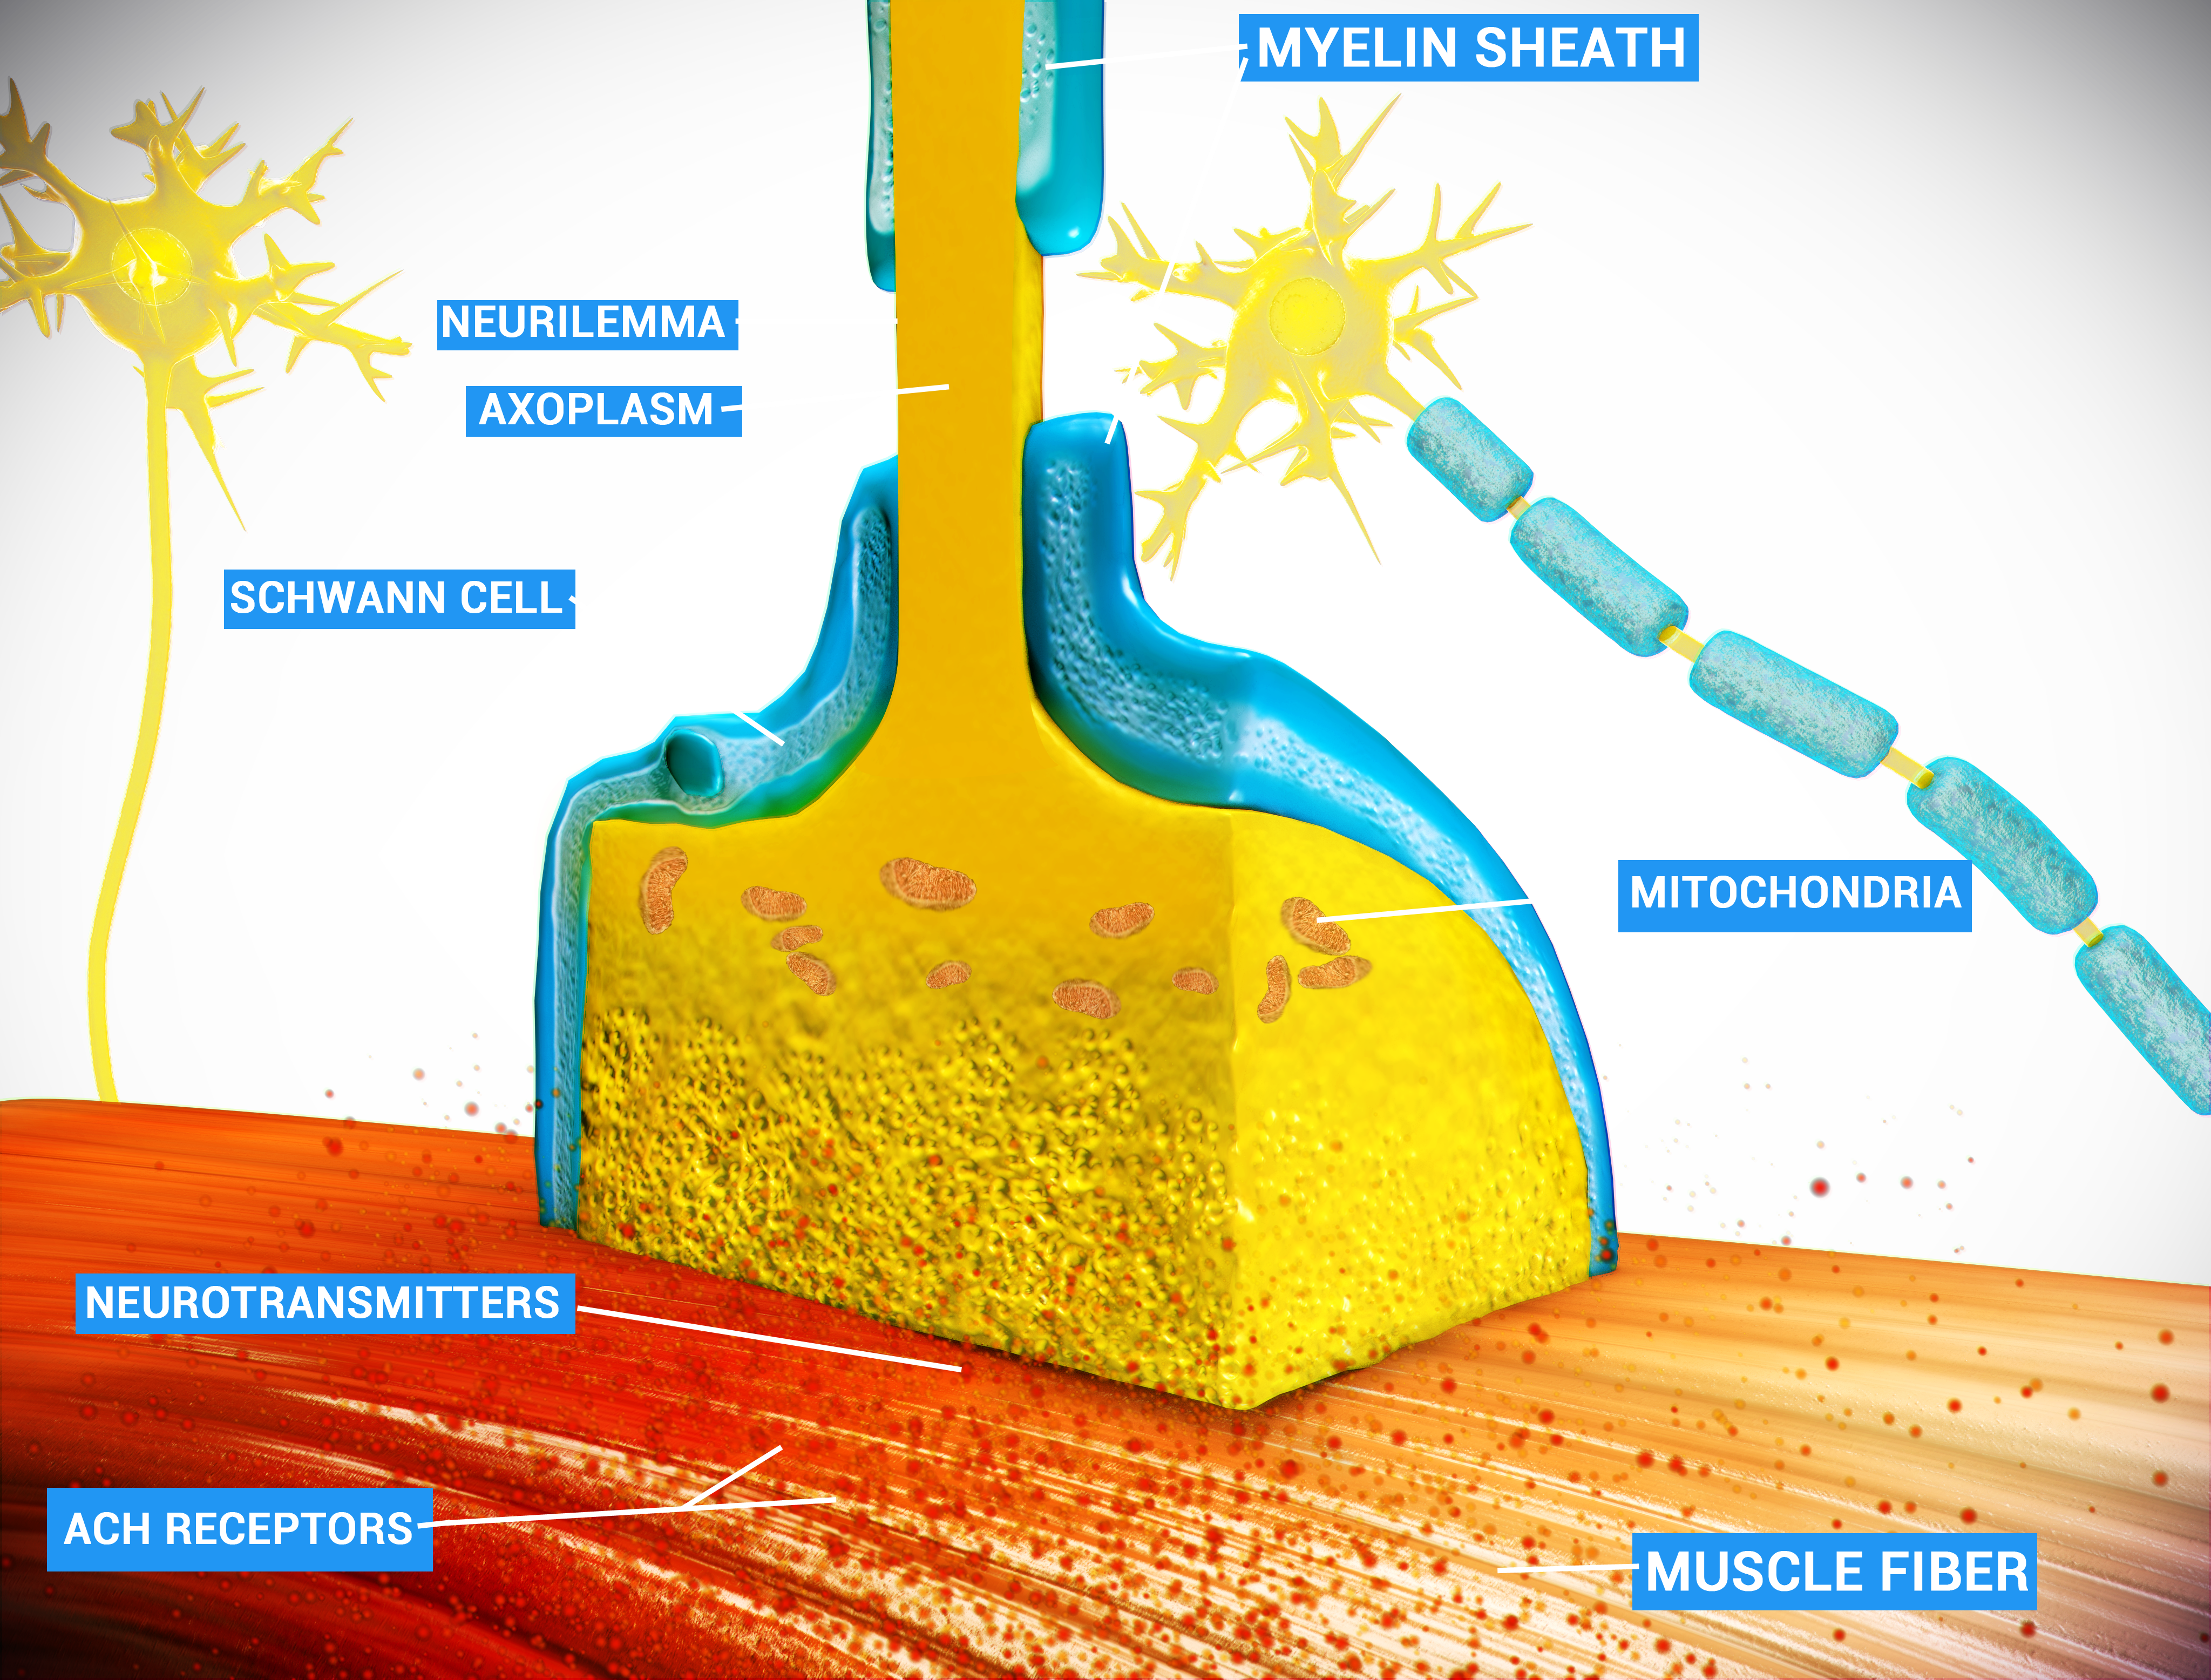
Figure 2
_Figure 2. Schematic of the neuromuscular junction. By Doctor Jana - http://docjana.com/#/nmj, CC BY 4.0, https://commons.wikimedia.org/w/index.php?curid=46835961_
A nerve stimulates muscle contraction through a process called excitation-contraction coupling.
Figure 3. This video summarizes the steps of excitation-contraction coupling.
Briefly:
- Action potentials traveling along an axon within a nerve arrive at the neuromuscular junction.
- Depolarization of the neuron causes release of a neurotransmitter (NT) from the presynaptic nerve terminal.
- NT diffuses to the muscle fiber where it binds with its receptor on the membrane of the muscle fiber, opening ion channels that generate an action potential in the muscle fiber.
- The action potential spreads throughout the length of the fiber, stimulating the release of Ca+2 from internal storage sites (the sarcoplasmic reticulum).
- Release of Ca+2 activates the contractile mechanism of the muscle fiber. Myosin thick filaments use energy from ATP cleavage to walk along actin thin filaments. The movement of millions of myosin heads over and over causes the entire myofiber to shorten (see figure below).
- Re-uptake of Ca+2 back into the sarcoplasmic reticulum allows the muscle fiber to relax once again.
How Nerve and Muscle Function Are Measured
It is difficult to record the contraction and relaxation of a single myofiber, but we CAN monitor what is happening at the macroscopic level of an entire muscle or nerve. These activities of a muscle or nerve mirror changes taking place at the molecular and cellular level. We record a myogram by attaching a muscle to a force transducer (a sensor that measures force), and recording the amount of force generated over a given time.
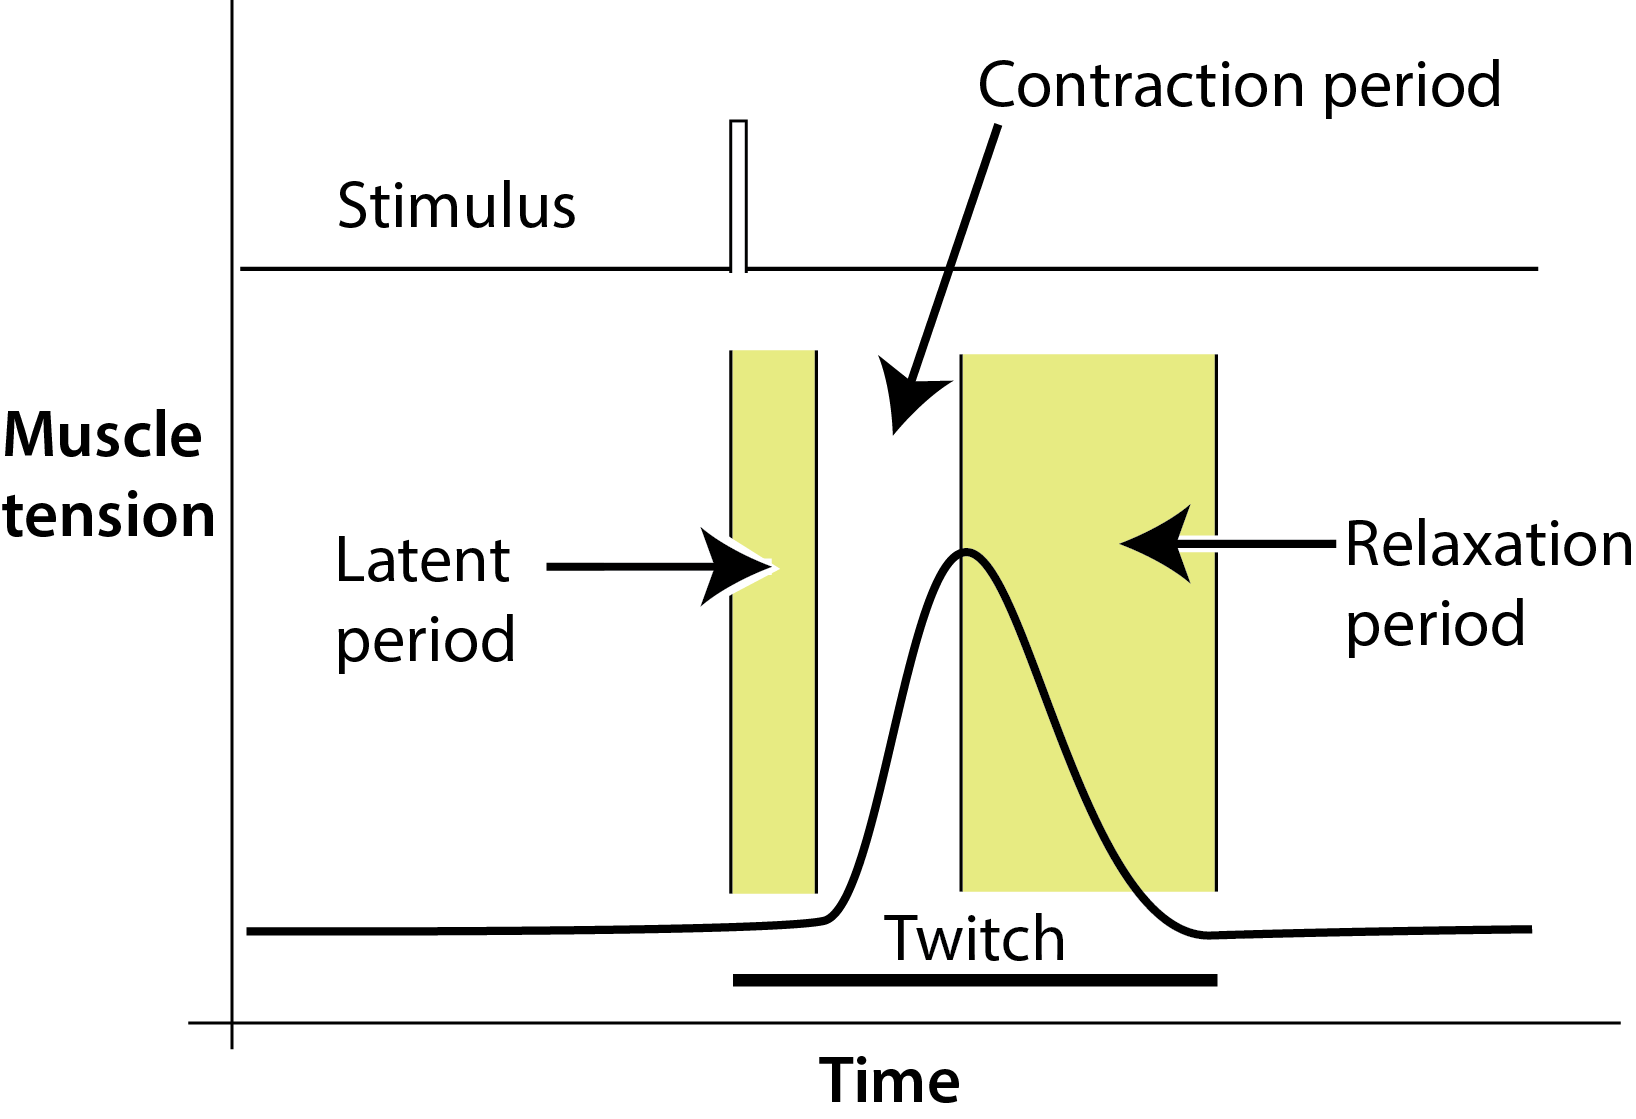
Figure 4
Figure 4. A myogram is a visual recording of the different stages within a single muscle twitch, and is collected by connecting the muscle to a force transducer. The transducer works by converting mechanical energy (muscle movement) into an electrical signal. This signal is fed through an amplifier to the computer.
A typical myogram will have three distinct phases: a latent period, the contraction phase, and the relaxation phase. The latent period is a very short time lapse between the time of stimulation and the start of contraction. In most muscles of the body, it lasts less than 10 msec. In the contraction phase the muscle shortens due to the chemical changes that occur within the fibers. After the contraction phase has reached its maximum, the muscle returns to its former relaxed state during the relaxation phase. The length of both the contraction and relaxation phases differs between various muscles in the body.
Informal Starting Questions & Observations
- Muscles rely on diffusion of ions and neurotransmitters. So will changes in physical conditions that affect diffusion of Ca+2 ions, neurotransmitters, etc., affect how a muscle contracts?
- All four sample reports explore this question, more specifically, how blocking diffusion of Ca+2 into nerves and muscles affects contraction.
- If a muscle is cold, will its ability to generate force be different than when it is warm? Or, will it have the same force, just contract more slowly?
- This is the informal question that the demonstration study explores.
- Is ACh the only neurotransmitter that can make muscles contract? What do other neurotransmitters do to muscles?
- Why does anesthetic block sensation, but the muscle can still move?
- How do toxic venoms paralyze prey?
Testable Research Question(s)
Initial observations:
- Diffusion rates increase as temperature increases.
- This is probably common knowledge.
- Both action potentials and excitation-contraction coupling require diffusion of ions and neurotransmitters.
- This is probably common knowledge.
- Enzyme-catalyzed reactions like ATP hydrolysis go more slowly when cold.
- Is there a citable source for this information?
Testable hypotheses:
- If decreasing temperature reduces all of the steps in muscle contraction, I predict:
- The time needed for one twitch contraction will be longeer.
- The force generated will still be the same, because no single step has been blocked.
- I need to make it clear that these are speculations, not facts I already know. That is why it is a testable hypothesis, not a known fact.
Experimental Methods
Force generated by the frog gastrocnemius muscle was measured using a mechanical transducer connected to an iWorx System for data collection. Briefly:
- Frogs were anesthetized using propofol, decapitated, then their hind legs removed using heavy scissors. Legs were stored on ice for up to 1 hour prior to use.
- Individual legs were skinned, then the gastrocnemius muscle separated from the femur and attached to the force transducer using cotton thread. The sciatic nerve was exposed by separating the muscles of the inner upper leg.
- The femur was pinned to a wax tray to keep the rest of the leg from moving. The sciatic nerve was gently pulled up and laid over two needle probes attached to the stimulus box of the iWorx System.
- Movements by the contracting muscle were measured by the force transducer then converted to a digital signal and plotted using the iWorx LabScribe3 software program. To collect data:
- The muscle was attached, and a baseline set of data collected by stimulating the sciatic nerve with a 5 volt stimulus for 0.1 seconds. This baseline step was repeated 5 times for one frog leg, to produce the control data for that leg.
- Next the muscle was surrounded for 15 minutes with frog Ringer’s solution at 4-5oC. Immediately after the cold solution was removed, another 5 myograms were collected from the same leg tested at room temperature.
- Once the myograms were collected, the leg was removed from the testing station, and a new leg prepared and tested.
- When the testing was completed, we had collected 10 myograms from each of 3 frog legs:
- 5 myograms were collected from muscles at room temperature
- 5 myograms were collected from cold-treated muscles
- To evaluate effects on muscle contraction, we used the LabScribe toolset to extract these values from raw myograms:
- Muscle latency (time between stimulation and contraction; msec)
- Contractile time (msec)
- Relaxation time (msec) and
- Maximum force (g) generated by each muscle.
Sample Dataset
| Leg # | Treatment | Myogram # | Latency (sec) | Contractile phase (sec) | Relaxation phase (sec) | Max. Contraction Force (g) |
|---|---|---|---|---|---|---|
| 1 | Pre-trx. | 1 | 0.037 | 0.082 | 0.140 | 14.73 |
| 2 | 0.036 | 0.079 | 0.137 | 14.29 | ||
| 3 | 0.039 | 0.083 | 0.144 | 15.02 | ||
| 4 | 0.040 | 0.079 | 0.146 | 14.14 | ||
| 5 | 0.037 | 0.081 | 0.139 | 14.59 | ||
| Cold | 1 | 0.046 | 0.111 | 0.202 | 11.78 | |
| 2 | 0.045 | 0.107 | 0.198 | 11.43 | ||
| 3 | 0.048 | 0.112 | 0.208 | 12.01 | ||
| 4 | 0.050 | 0.106 | 0.210 | 11.31 | ||
| 5 | 0.046 | 0.110 | 0.200 | 11.68 | ||
| 2 | Pre-trx. | 1 | 0.035 | 0.078 | 0.131 | 14.06 |
| 2 | 0.034 | 0.075 | 0.128 | 13.20 | ||
| 3 | 0.037 | 0.079 | 0.135 | 14.37 | ||
| 4 | 0.036 | 0.074 | 0.136 | 13.19 | ||
| 5 | 0.035 | 0.077 | 0.130 | 13.77 | ||
| Cold | 1 | 0.043 | 0.105 | 0.189 | 11.25 | |
| 2 | 0.042 | 0.102 | 0.185 | 10.56 | ||
| 3 | 0.046 | 0.107 | 0.194 | 11.50 | ||
| 4 | 0.045 | 0.101 | 0.196 | 10.55 | ||
| 5 | 0.043 | 0.104 | 0.187 | 11.02 | ||
| 3 | Pre-trx. | 1 | 0.032 | 0.071 | 0.125 | 13.09 |
| 2 | 0.032 | 0.072 | 0.122 | 12.70 | ||
| 3 | 0.034 | 0.074 | 0.128 | 13.35 | ||
| 4 | 0.035 | 0.071 | 0.130 | 12.58 | ||
| 5 | 0.033 | 0.074 | 0.123 | 12.98 | ||
| Cold | 1 | 0.040 | 0.096 | 0.179 | 10.47 | |
| 2 | 0.040 | 0.097 | 0.176 | 10.16 | ||
| 3 | 0.043 | 0.099 | 0.185 | 10.68 | ||
| 4 | 0.043 | 0.095 | 0.187 | 10.06 | ||
| 5 | 0.041 | 0.100 | 0.178 | 10.38 |
Notes For Instructors
This experimental setup may be difficult for students to imagine if they do not work with this model system and equipment. Oorient them by showing students the experimental setup using one or more of the training videos on the iWorx YouTube channel at https://www.youtube.com/c/iworxsystems/videos. If students use another version of this equipment locally, switch the link to match that vendor.
The results in the sample dataset are best summarized using either side-by-side or stacked bar graphs. XY graphs or box-and-whisker plots are not appropriate ways to summarize this dataset.
When students analyze the data from this experiment, they should use a repeated measures t-test for comparing control and cold-treated groups. Non-paired t-tests are not the best choice, but will work. Students should not use ANOVA, because they would be comparing non-equivalent types of measurements (e.g., time and force).